Carbon market intelligence for trading and analytics teams

Monitor carbon prices, policy signals, market balance, and cross-market drivers across global carbon markets.

Veyt combines market data, proprietary models, and analyst interpretation to help trading and analytics teams understand what is moving carbon markets, why it matters, and how it may affect positioning.

  • EU ETS1
  • EU ETS2
  • North American Carbon
  • Global Carbon Credits

Carbon market intelligence for trading and analytics teams

Monitor carbon prices, policy signals, market balance, and cross-market drivers across global carbon markets.

Veyt combines market data, proprietary models, and analyst interpretation to help trading and analytics teams understand what is moving carbon markets, why it matters, and how it may affect positioning.

  • EU ETS1
  • EU ETS2
  • North American Carbon
  • Global Carbon Credits

Intelligence platform

Data API

Modern market intelligence platform with API and Excel integration

Newsletter

Industry

Net zero market solutions

What carbon traders monitor with Veyt

Carbon trading requires a view across carbon price movements, policy developments, market balance, abatement costs, and emission output, and adjacent energy markets.

Veyt helps trading and analytics teams connect those signals into a structured market view. 

Trading signals and metrics

These signals help traders distinguish between price moves driven by fundamentals, policy, positioning, and short-term market behaviour.

Benchmark prices and forward-looking curves
  • EUA and carbon benchmark prices anchor trading and positioning decisions
  • Historical price series and forecasts support short- and medium-term market views
  • Price curves help compare current pricing with future market expectations
Auction outcomes
  • Auction clearing prices signal near-term demand and price strength
  • Bid-to-cover ratios indicate participation and market tightness
  • Auction volumes and schedules affect short-term supply expectations
Market balance outlook
  • Supply–demand models show whether the market is tightening or loosening
  • Structural surplus or deficit shapes medium- and long-term price direction
  • Balance changes help explain price moves beyond short-term sentiment
Policy signals
  • Legislative developments can shift market expectations before implementation
  • Reform proposals affect assumptions around future supply and demand
  • Regulatory uncertainty creates volatility and scenario dispersion
Energy market movements
  • Power and fuel prices affect emissions and carbon demand
  • Gas, coal, and power market changes influence marginal abatement incentives
  • Energy market volatility feeds into carbon price movements
Participant behaviour and liquidity
  • Positioning can amplify short-term price movements
  • Liquidity affects volatility, spreads, and execution conditions
  • Technical analysis and short-term price signals help traders assess momentum, support, and resistance levels
  • Daily and weekly reports connect technical signals with fundamentals, policy, and market behaviour
Drivers
Tracking short- and long-term market trends to clarify current and potential impacts from disparate drivers
Market behaviour
Analysing participant behaviour and market sentiment while commenting on price drivers. An in-depth focus on industry sectors by understanding their marginal abatement costs and trade behaviour allows for informed decision-making. Our pan-European power market modelling is the backbone for our granular utility-sector insights and hedging strategy analysis
Policy developments
Following relevant European carbon and energy market legislation, providing foresight on political outcomes, and assessing market impacts
Supply & demand forecasts
Generating insights on how policy ambition and regulatory change shape short- and long-term supply dynamics. Addressing sensitivities of key assumptions for EU ETS market participants. Following sector-specific trends, production data, and decarbonisation pathways to track and forecast demand for carbon European Union allowances (EUAs)
Technical analysis
Identifying key trends in the market, spotting relevant support/resistance levels, and technical patterns
Market data
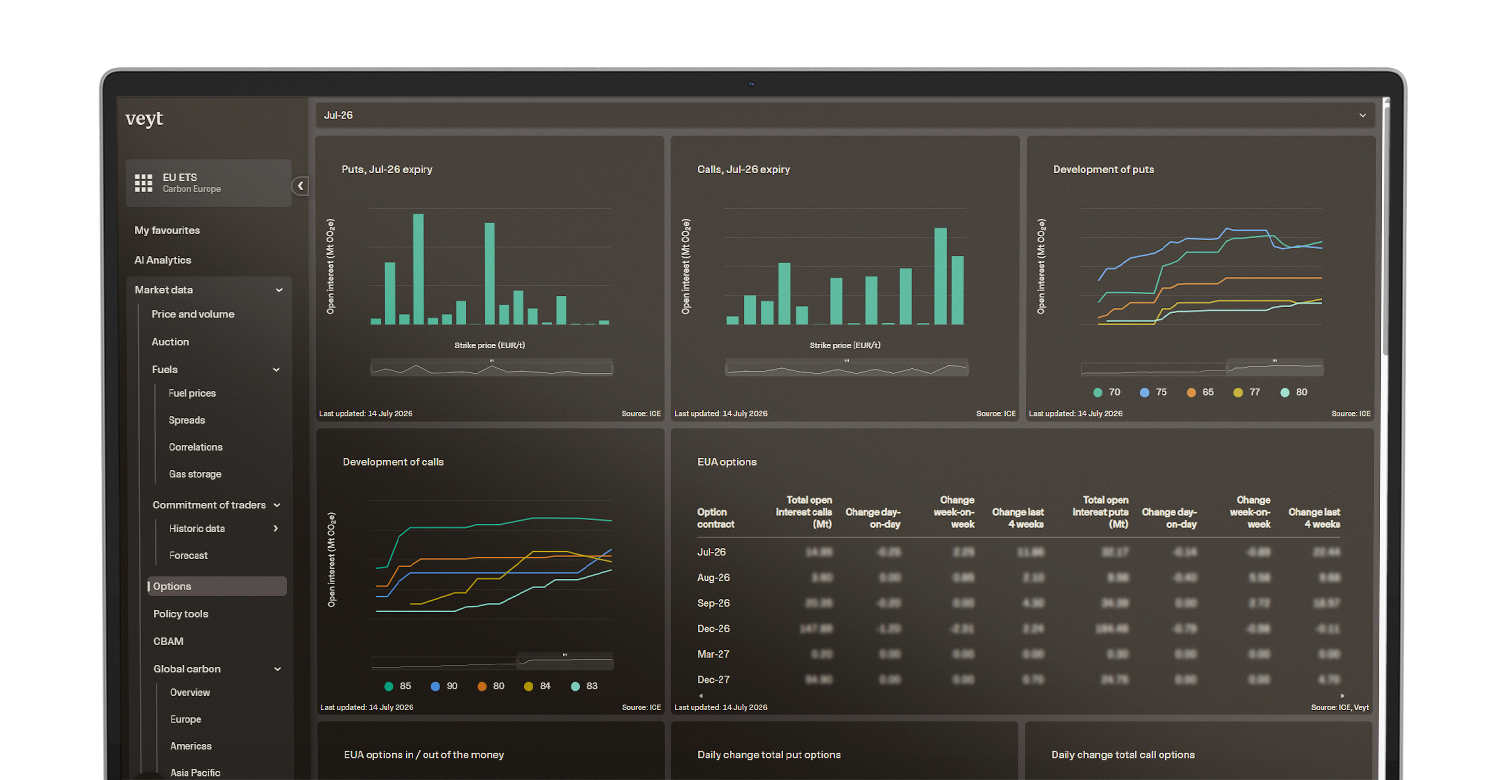
Key market data for the EU ETS and the wider energy complex. Prices, volume, open interest, seasonality charts to assess liquidity, and participant behaviour

Key market drivers traders monitors

Carbon traders monitor the interaction between policy, supply, demand, energy markets and market behaviour. 

Regulatory frameworks define supply, demand, and compliance obligations
Policy announcements move carbon prices ahead of implementation
Reform timelines shape market positioning and volatility
Allocation, auctions, and emissions trends determine market tightness
Structural balance shapes medium- and long-term price expectations
Compliance demand affects short-term market pressure
Power and fuel prices influence emissions and abatement incentives
Fuel switching affects marginal carbon demand
Weather-driven generation changes feed into allowance demand
Industrial output affects emissions and compliance demand
Economic conditions influence emissions and compliance demand
Geopolitical developments impact fuel markets and carbon pricing
Speculator positioning can amplify short-term carbon price movements
Liquidity conditions affect volatility and execution risk
Auction demand, volumes, and spreads signal near-term market pressure
Abatement costs influence long-term carbon price trajectories
Technology deployment affects structural allowance demand
Sector decarbonisation changes future compliance exposure

How trading teams use Veyt to support daily decisions

Veyt helps trading teams move from fragmented market signals to a structured view of carbon price direction, risk, and opportunity. 

Market monitoring
Trade strategy and positioning
Scenario analysis
Cross-market analysis
Opportunity identification
Market signal
  • Price movements
  • Auction results
  • Policy updates
  • Emissions data
  • Energy market movements
  • Participant behaviour
Market interpretation
  • What changed?
  • Which driver caused it?
  • Is it temporary or structural?
  • Is it priced in?
  • What does it mean for balance?
Investment view
  • Directional market view
  • Scenario-adjusted price expectation
  • Volatility and downside risk assessment
  • Cross-market signal comparison
  • Positioning and timing support

Carbon trading workflow

From signal to trading view

Veyt supports the full workflow from market signal identification to trading interpretation.

Customisable views for trading workflows

Different trading teams need different levels of granularity depending on market exposure, time horizon, and strategy.

Carbon trading desks
Cross-market traders
Market analysts
Policy-focused analysts
Quantitative and modelling teams

Carbon risk platform — at a glance

The Veyt platform gives trading and analytics teams access to carbon market data, forecasts, policy analysis, dashboards, and analyst commentary.

Carbon price dashboards
Forecast price ranges
Compliance market balance
Policy scenario analysis
Emissions and compliance data
Volatility and auction indicators
Market activity insights
Cross-market dashboards

What the platform provides

Standard capabilities

Additional capabilities

Who this is for

Search